Finding the right Business Intelligence (BI) Tool that will serve your organization’s needs can be challenging. There are a lot of options on the market with varying capabilities and features. Let us look at some key factors one needs to take into consideration when selecting a BI tool.
With a BI Tool, there are 2 key personas involved, the data producer and the data consumer. Examples of data producers would be your data analyst, BI analyst, visualization analyst, data engineer. Data consumers are primarily going to be the end users such as the executive team, sales team, CSMs etc. Each of them will have varying degrees of familiarity when it comes to working with data and their needs and expectations from a BI Tool are going to be different. Some of the criteria that will be discussed further on will be more relevant to the analyst who is modeling your raw data versus the CFO who primarily interfaces with your organization’s data via a maintained dashboard.
As we dive deep, we shall compare and contrast how the following BI Tools, currently on the market, and see how they stack up against each other across the varying criteria.
- Domo
- Holistics
- Looker
- Metabase
- Mode
- Tableau
Data Integration
One of the first considerations is understanding where your data is coming from and whether it can be easily ingested or queried from the BI Tool.
Almost all BI Tools support querying data from a SQL database or data warehouse such Postgres, SQL Server, Snowflake, Big Query, or Redshift. However if your data does not reside in a database, and you do not plan on implementing this architecture, it would be more apt to consider BI Tools that have built-in data connectors.
Domo excels in this arena. Domo is not just a BI tool but is in fact an entire data platform i.e. data integration, data transformation, and data visualization. Domo has connectors to over 1000 data sources, this includes API sources (Facebook, Salesforce, Zendesk), storage systems (S3, FTP), file upload (CSV), email attachments, etc.
The Looker data marketplace does have some data integrations, however if you explore some of these, they are via 3rd party ETL Tools such as Stitch or Fivetran that will still require the use of an intermediate data warehouse.
Visualization
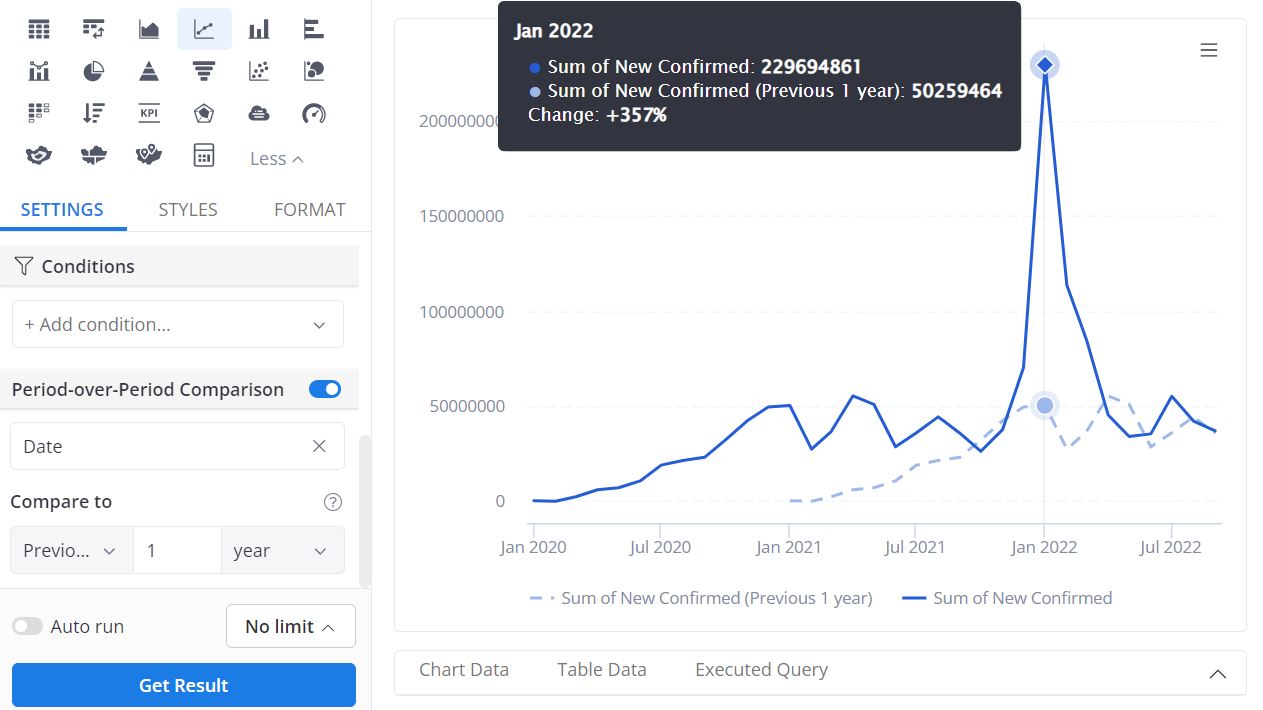
It is important to have an understanding of the key metrics your team wants visualized and whether or not the BI Tool supports that. Beyond the basic bar, line, and pie chart, your team may be interested in funnel analysis or flexible Period over Period (e.g. YoY) charts. Visualization capabilities are important not just for data consumers but also for data producers. How a BI Tool is able to present data can also influence how you model the data. Looking at the PoP example, with the Holistics BI Tool, you can easily build a YoY graph, however with Looker, it is not so straightforward and requires additional data modeling.
*Screenshot from Holistics Platform
You also want to consider overall dashboard capabilities. That is, are you able to implement dashboard level filters, can you have cross visualization interactions within a dashboard, can you drill down into the data from the dashboard? In terms of overall visualization capabilities, Tableau has been known to excel in this arena.
Pricing
Documentation
Additional Considerations
Data Access Control – The ability to control which data different user groups have access to is important especially if your organization deals with sensitive data such as PII or PHI. While most BI tools allow you to control access to reports, dashboards, and visualizations, tools such as Looker, Tableau and Holistics allow you to implement Row Level Security (RLS) on your data.
Source Control – Looker and Holistics have version control built into the deployment process on the data modeling side. The ability to track and manage changes goes a long way in ensuring that a change pushed to your data model does not break your dashboards.
- Portability – It is not uncommon for an organization to migrate to a different BI tool especially as organizational size and needs change. As I have mentioned previously Domo is an entire data platform, and while that can be advantageous, it does make it hard to migrate to another BI Tool because all aspects of your data architecture will need to be re-written. For example, Domo’s Magic ETL while a great data transformation product is primarily drag and drop as opposed to SQL code that can easily be translated across platforms.
- Embedded Analytics – A number of BI Tools these days offer an embedded analytics feature. This can be a very powerful and useful asset in your customer facing application. It is however important to understand how the embedded analytics works for the BI tool and how easily it can be integrated in your application.
- API – While this feature might not be at the forefront of what you are looking for in a BI Tool, choosing a tool with a robust API can provide a lot of benefits down the line. For example the Looker API can help you better understand the usage of fields, datasets, and dashboards over time. This can help you focus on improving what is relevant to data consumers and also what needs to be cleaned up and deprecated.
- Testing – Most data teams have a testing suite or methodology outside of their BI Tool. There are however benefits to having a tool that allows you to add tests to your metrics and formulas within the BI platform itself, for example with Looker’s data tests. This is especially helpful in either preventing broken dashboards or catching such errors early.

