
Introduction
If you’re considering using the Power BI platform and would like an introduction to how it works, and how you can build basic reports and dashboards for your organization, keep reading.
Architecture
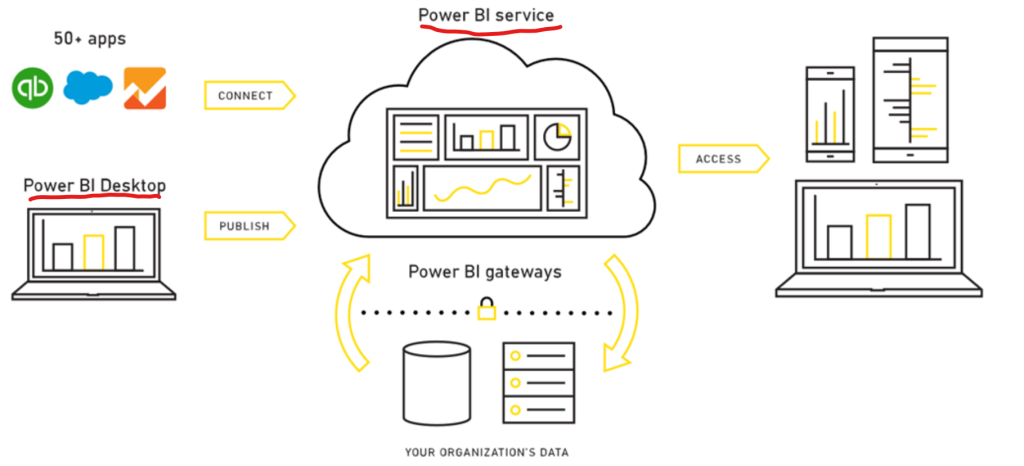
If your team is migrating from a BI Tool such as Looker, which offers a cloud based, version controlled workflow, working with Power BI is going to be different. The first thing to understand is that Power BI primarily has two components. Power BI Desktop and Power BI Service. There are other components that are part of the Power BI ecosystem such as the gateways, report server, dataflows, datamarts, etc., which are important but aren’t integral to getting started with Power BI for a basic use-case.
Power BI Desktop
Power BI Desktop (PBI Desktop) is a windows application that has to be downloaded and installed on your OS. If you’re on a Mac, you will need to find an alternative solution, such as installing it on a VM. For most teams, PBI Desktop is the starting point for working with Power BI. Once installed, you are able to pull in data from various sources, transform and clean the data, build visualizations, save a report as a file (.pbix file extension) and finally publish your work to Power BI Service. Until a report has been published, it resides just locally on your computer. Other users on your team will not have access to your local report unless they view it directly on your computer.

Power BI Service
When you publish a report from PBI Desktop, it’s uploaded to Power BI Service (PBI Service). PBI Service is the second primary component of the Power BI architecture. It’s an online platform that a lot of end users will interact with. It is not identical to PBI Desktop, however it integrates with it. In PBI Service you can view reports that have been published from PBI desktop by various other users across your organization. You can also create dashboards and share them with other users. Reports published to PBI service are organized into Workspaces. Each Power BI user will have their own personal Workspace in addition to other organization Workspaces they may be members of.
Once your Power BI file has been successfully published to a Workspace from PBI Desktop, you will notice that there are 2 files created. The report itself and a dataset file. Datasets have recently been renamed to Semantic models, but for simplicity will still be referred to as datasets. Datasets also allow other Power BI Service users to create additional reports from the same data without setting up PBI Desktop rebuilding the dataset.

Publishing from Power BI Desktop saves to Power BI Service
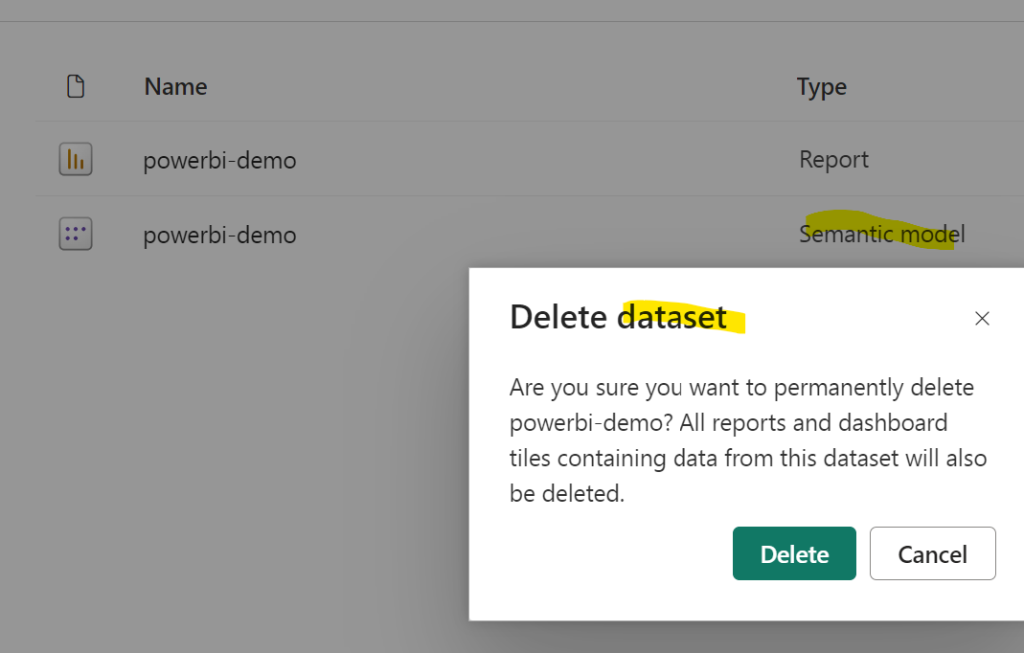
Terminology change from dataset to Semantic model still in progress.
You will also notice that once your dataset has been published to PBI Service, there is now a preview feature that will allow users with the right permissions in PBI Service to manipulate your dataset, e.g. add new columns. It is important to note that if a local .pbix file is re-published, the online PBI Service version and any changes it may have is overwritten.
You may be asking, can you build reports directly in Power BI Service bypassing Power BI Desktop? This is especially relevant if you’re not on the Windows OS. The simple answer is yes, for example, Power BI allows you to paste data into PBI Service, which will create a dataset directly in your Workspace. PBI Service can also allow you to create datamarts which will also create a dataset that will allow you to build reports, however this is a premium feature. There is still a strong dependency with PBI Desktop for most data sources and workflows, especially for Power BI Free and Pro users.

Key Concepts
The next section will cover key concepts and terms you will come across as you start building reports in Power BI.
Data Sources
Power BI supports ingesting data from a vast number of data sources including CSV files, databases, data warehouses, CRMs such as Salesforce etc. As mentioned before, PBI Desktop is the general starting point when you want to start building your reports, and the first step is clicking the Get Data button and finding the source for your data. There are primarily two options for how the data will be pulled in when you start building your visuals, Import and Direct Query. With Import, e.g. importing a CSV file, the data is imported directly into the .pbix file. With Direct Query, the raw data remains in the data source and the pbix file queries the data at the source and pulls it in to generate a visual. A good example is having a SQL database as a data source configured with Direct Query. While all the raw data in your tables remains in your database, SQL queries are generated and sent from your .pbix file to your database which responds with the data requested to populate a visual. Keep in mind that some data is cached with Direct Query. There is a third option of a Live Connection, which you may come across. It is similar to Direct Query but is only supported for a limited number of data sources as is described in detail here.
To reiterate, when you publish a .pbix file from desktop to service, 2 files are generated, the report, which contains the visualizations you’ve built and the dataset aka Semantic model file. The dataset file is what stores the imported data or in the case of Direct Query, the underlying queries needed to populate the report.
For datasets where you do need to authenticate, e.g. a SQL database, the necessary credentials need to be configured and set in both on PBI Desktop and PBI Service so that your data can be loaded both locally and in the cloud.
Data Transformation
When you get your data into a PBI Desktop file, 9 times out of 10, you will need to do some degree of data transformation and cleanup, whether it includes renaming columns, removing null values, changing column types e.g. string to date, etc. Power BI Desktop provides a Power Query Editor which includes a set of data transformation tools powered by the Power Query M language that will allow you to manipulate your data from a specified data source and also join data pulled from multiple sources.
Please note that action steps generated when you click through the Power Query editor user interface are translated to Power Query M functions and expressions, which you can also manually edit in the Advanced Power Query editor. This is especially helpful and convenient for complicated data transformations such as a group by and apply.
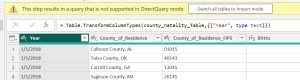
Secondly, certain transformation steps / formulas may only be available in Import mode. When you come across a prompt asking you to switch to Import Mode, understand that and once you switch to Import mode you cannot revert back to Direct Query.

Columns and Measures
In Power Query Editor, you will notice that you are able to create new columns in the “Add Column” tab. However, you are also able to create additional calculated columns and measures in the main PBI Desktop Report view. This can be done by either right clicking in the data section or navigating to the Modeling tab. These calculated fields use Data Analysis Expressions (DAX) formula syntax. Yes, there are two different languages used in Power BI for data manipulation. Note that the syntax for DAX queries is different from the Power Query M formulas used in the Power Query Editor.
You may be curious as to when to create a calculated column vs measure.
Calculated columns are generally used when you want to create a new field that currently doesn’t exist in your data table. For example you have a table called Customers that you have imported, with one row for each customer. For each customer record you would like to know their Status, e.g. New, Active, Legacy based on whether or not they have completed an order and if so, how long ago their last order date was. Let’s assume that the customer table has a column named Last Order Date, which can be null. To do so, you would create a new calculated column named Status using a DAX function that would check the value of the Last Order Date column and return an appropriate status based on the value. This new Status calculated column can then be used in charts and also as a filter.
Calculated measures are generally used when you want to summarize, rollup or apply an arithmetic formula to your data. An example of a measure using the Customer table would be the total count of customers or the total count of customers who have successfully completed an order.

Visualizations
With your data loaded, transformed, new columns and measures created, the next step is to start building your visualizations. To start, select the type of visualization you would like to create e.g. bar chart, line chart, table, etc, and simply drag the appropriate fields from the data pane into the appropriate sections of the visualization pane, e.g. – axis and y-axis. The visualization pane also includes a Format tab that allows you to customize your visual e.g. adding a title, changing the font of your axes, changing the colors of your bar chart, adding a legend etc.

When you start building your visualizations, you will notice a few things:
- Fields that are selected for the visual are automatically added to the filter section. You have the ability to specify whether you want filters to apply to the visual only, a single report page, or all pages of the report. You can also bring other fields into the filter section that are not part of the visual itself.
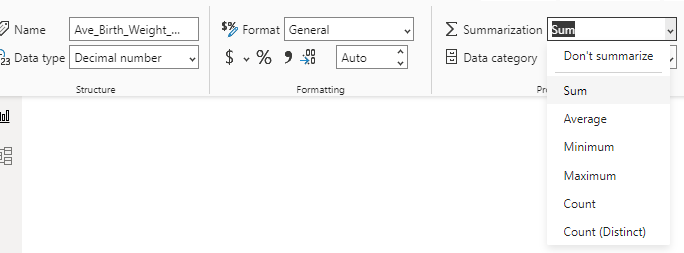
- Numeric type fields (number, decimal) will be summarized as a Sum by default when dragged into specific sections, such as the Y axis of a bar graph which expects some type of aggregated field or measure. You have the option to change the summarization to another type that is more appropriate for your data such as average or count within the visualization settings. Alternatively you can also change the default summarization type.
Dashboards
While you can create reports in Power BI Desktop, creating dashboards can only be done in Power BI Service. Once you publish your .pbix file with your report and dataset. You can pin pages of a report to a dashboard.
An important thing to keep in mind is that while you can copy reports across Workspaces, currently you cannot copy dashboards across Workspaces. They would need to be recreated.
Conclusion
Hopefully this blog has provided you with the basic understanding of Power BI architecture, functionality, and requirements for building and publishing reports.
For those who have previously used Power BI, you may notice some changes. For example, Microsoft recently introduced the Fabric data ecosystem, which Power BI is now a part of and all new and existing Power BI users can now preview. Additionally, some new terminology changes and features have been introduced, however the core functionality remains.